The Bubalus bubalis genome
was sequenced at 17X-19X depth and 91%-95% coverage through a
collaboration between the National Bureau of Animal Genetic Resources
(NBAGR) in Karnal; the Central Institute for Research on Buffaloes (CIRB)
in Hisar; and the Animal Science Division of the Indian Council of
Agricultural Research (ICAR).
Copy of data (obtained from URL http://210.212.93.84/bbu_2.0alpha/) used in database development and analysis work is available on request . (Reference: Tantia MS, Vijh RK, Bhasin V, Sikka P, Vij PK, Kataria RS, Mishra BP, Yadav SP, Pandey AK, Sethi RK, Joshi BK, Gupta SC, Pathak KML. Whole-genome sequence assembly of the water buffalo (Bubalus bubalis). The Indian Journal of Animal Sciences 2011, 81(5): 38-46).
All the 27 chromosomes (Chromosome
1-24, M, U and X) were chopped into manageable range of 50000 bp using
PERL script. These fragments were given to MIcroSAtellite identification
tool (MISA) to identify and find the location of perfect and compound
microsatellites for all the chromosomes of buffalo genome. The STR
numbers, motifs, repeat number, length of the repeat, size of the repeat,
repeat type, GC content, start and end position of the repeat and STR
sequence has been compiled.Chromosome wise description of the STRs have
been tabulated as well as represented as graphs. The mono, di, tri, tetra,
penta and hexa type of microsatellites have been plotted to show the
abundance of the type in chromosomes.In addition, facility to locate the
STRs on chromosomes based on the position number is incorporated which may
be very useful to the animal biotechnologists. The tabulation of simple
versus compound shows the proportion of the same.
Scientific name |
Common name |
Order |
Chr. no. |
Genome Size
(MB) |
GC% |
Bubalis bubalus |
Water Buffalo |
Bovidae |
27 (24+M, U and X) |
21.6752 |
18.03 |
Table 1. Description of Buffalo genome
Type |
Number |
Percentage |
Simple |
830058 |
91.16 |
Compound |
80471 |
8.84 |
Total |
|
100.00 |
Table 2. Distribution of microsatellite types in Buffalo genome
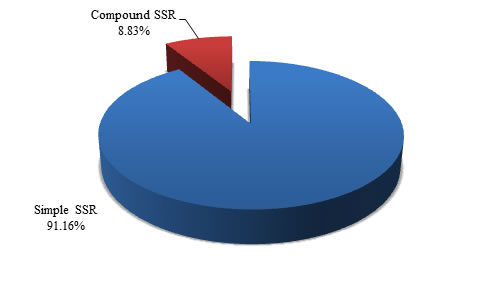
Figure 1. Graphical view of microsatellite types in Buffalo genome
Motif Type |
Number |
Percentage
(%) |
Mono |
535570 |
64.52 |
Di
|
168741
|
20.33
|
Tri |
106499 |
12.83 |
Tetra |
6694 |
0.81 |
Penta |
12388 |
1.49 |
Hexa |
166 |
0.02 |
Table 3. Motif wise distribution of microsatellites in Buffalo genome
Chromosome |
Simple |
Compound |
Mono |
Di |
Tri |
Tetra |
Penta |
Hexa |
1 |
38690 | 12112 |
7672 |
454 |
1005 |
10 |
5858 |
2 |
35354 |
10911 |
7062 |
419 |
877 |
10 |
4899 |
3 |
32231 |
10406 |
6376 |
408 |
702 |
6 |
4611 |
4 |
30416 |
9552 |
6308 |
404 |
734 |
13 |
4382 |
5 |
22149 |
7486 |
4568 |
314 |
489 |
6 |
3365 |
6 |
20993 |
6941 |
4525 |
263 |
532 |
8 |
3132 |
7 |
21961 |
6884 |
4553 |
291 |
616 |
7 |
3282 |
8 |
22977 |
7190 |
4787 |
252 |
512 |
7 |
3333 |
9 |
20647 |
6278 |
4079 |
260 |
440 |
3 |
2937 |
10 |
20550 |
6425 |
4156 |
228 |
530 |
4 |
3082 |
11 |
19223 |
5662 |
3852 |
206 |
393 |
8 |
2701 |
12 |
19447 |
6285 |
3748 |
238 |
441 |
6 |
2725 |
13 |
17237 |
5220 |
3285 |
199 |
362 |
3 |
2721 |
14 |
15197 |
4703 |
2841 |
197 |
313 |
3 |
2162 |
15 |
14760 |
4892 |
2988 |
149 |
342 |
4 |
2219 |
16 |
15128 |
4630 |
3152 |
185 |
359 |
6 |
2353 |
17 |
14489 |
4585 |
2721 |
194 |
270 |
2 |
2160 |
18 |
11619 |
3814 |
2129 |
160 |
181 |
3 |
1746 |
19 |
13496 |
4373 |
2804 |
155 |
358 |
5 |
2098 |
20 |
12474 |
3949 |
2465 |
159 |
274 |
3 |
1832 |
21 |
11830 |
3467 |
2106 |
124 |
203 |
5 |
1588 |
22 |
12015 |
3893 |
2424 |
117 |
278 |
4 |
1705 |
23 |
18764 |
5898 |
3686 |
180 |
380 |
2 |
2704 |
24 |
7742 |
2571 |
1467 |
124 |
136 |
3 |
1127 |
M |
1 |
0 |
0 |
0 |
0 |
0 |
0 |
U |
50940 |
15373 |
9458 |
790 |
1279 |
26 |
9045 |
X |
15239 |
5241 |
3287 |
224 |
382 |
9 |
2704 |
Table 4. Motif wise distribution of microsatellites in Buffalo chromosomes
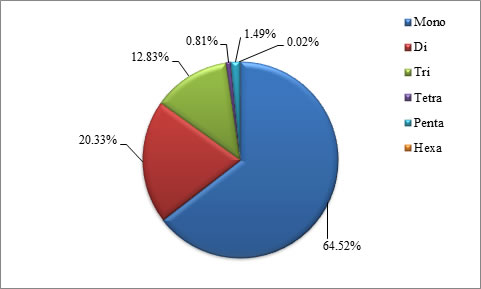
Figure 2. Graphical view of motif wise distribution of microsatellites in Buffalo genome
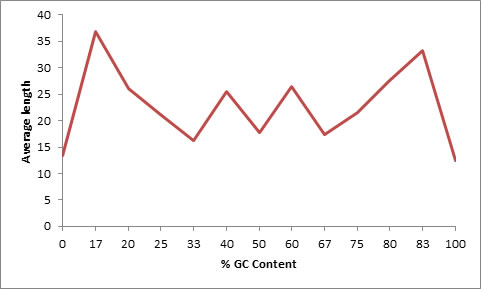
Figure 3. Distribution of length of microsatellites in context to GC percentage
Class |
Frequency of GC
content
|
Percentage |
0-10 |
570674 |
68.751 |
|
|
|
|
|
|
|
|
|
|
|
|
|
|
|
|
|
|
|
|
|
|
|
|
|
|
|
Table 5. Proportion of GC content in STRs at various ranges
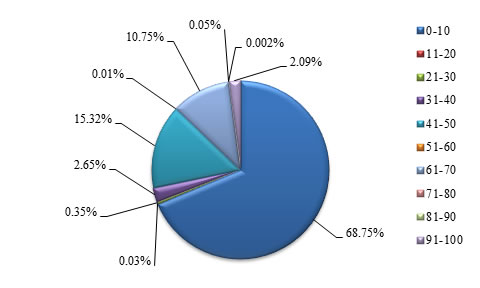
Figure 4. Graphical view of proportion of GC content in STRs at various ranges
Table 6. Frequencies of STRs based on their sizes
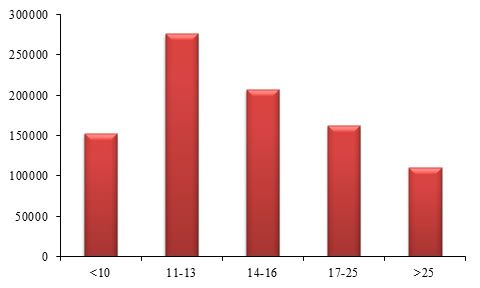
Figure 5. Graphical view of STR frequencies based on their sizes
Table 7. Proportion of STRs based on Repeats’ classes
|